an129: Harmonics and Utility Costs
Application Note
Preamble
In this age of electronics, most modern electrical equipment has embedded microprocessors and electronic circuitry to increase functionality and efficiency. This type of equipment generally represents a nonlinear load resulting in nonsinusoidal line currents, which are rich in harmonics. Moreover, modern LED lighting generates line current harmonics. Nonlinearities of magnetic fields in transformers and rotating air gaps create some harmonics as well. The objective of this Application Note is to briefly show how these types of harmonics in a customer’s facility affect utility-measured quantities and costs. For simplicity and ease of reading, the laborious math associated with the concepts presented here will be omitted.Readers are encouraged to read Dataforth’s two Application Notes on RMS measurements as reference background for this Application Note; both documents contain some background calculations that one might find refreshing. See References on page 5.
Definitions Revisited
Although it may be unnecessary and redundant for some readers, a reminder about some of the common terms and equations used by utility power companies might be helpful. NOTE: In the following definitions, all voltages and currents are RMS values and of the same single frequency unless otherwise specified.Current is the flow of charge per second where one amp is defined as one coulomb per second. The charge carrier is an electron, which has a charge of 1.6E-19 coulomb. Note that just one amp is over 6E18 (million trillion) electrons screaming along the wire. WOW!
Voltage is the potential energy of charge at a point where the difference between the potential energy of charge at point “a” and the potential energy of charge at point “b” is defined as voltage (Vab) in joules/coulombs. This is the voltage one measures.
Energy (electrical) has the units of joules, which is volts (joules per coulomb) x current (coulombs per second) x time (seconds).
Power (electrical) is the rate per unit time of energy used or generated in units of watts, which is defined as joules per second. Note that volts (joules per coulomb) x current (coulombs per second) is joules / second.
DC Power is calculated in a straightforward manner by simply multiplying DC volts times DC current yielding watts (joules per second).
AC Power also has the units of watts; however, the calculation utilizes some of the vector properties of AC sinusoidal current and voltage behavior. Specifically, AC watts are mathematically defined as the instantaneous product of voltage and current averaged over one period of the sinusoidal base frequency.
Recall the familiar “Power Triangle” as shown in Figure 1, illustrating the relationship between the quantities KW, KVA, KVAR, and PF found in AC sinusoidal power distribution systems. Power Triangles were developed as a convenient “tool” for dealing with “vector power quantities” in a system where the supply voltage and corresponding current are both of the same frequency and where the components are linear elements. Power Triangle vector orientations are described below.
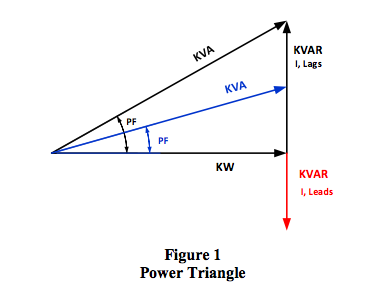
Real Power (KW): In electrical distribution systems “real power” is the rate at which electrical energy is converted to work, measured in KW. This vector quantity is defined in the Power Triangle of Figure 1 on the horizontal axis at zero degrees as KVA*PF, where PF is the cosine of the displacement angle between current and voltage with no harmonics.
Power Factor (PF): The System Power Factor (PF) is the cosine of the angle whose tangent is the net KVAR divided by KW. Power factor angles represent the “displacement” angle between voltage and current caused by the system reactive elements of inductance and capacitance. Recall that capacitance reactance subtracts from inductance reactance and can be used to reduce the PF in inductance dominated systems as shown in Figure 1 by the Red and Blue vectors.
Reactive Power (KVAR): KVAR quantities have a +/- rotation and are the product of voltage across the net reactance (either inductance, capacitance, or a combination) times the current flowing through this reactance element. This represents the units of reactive watts. Total KVAR, is inductance KVAR minus capacitance KVAR and results in the net KVA vector in Figure 1.
Apparent Power (KVA): The magnitude of the product of voltage across a load times the current through this load has the units of watts and is the vector KVA with the PF angle in Figure 1.
Power Triangle Equations
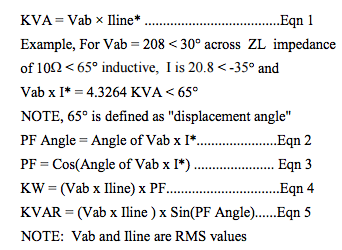
In the equations listed below, KVA, KVAR, and KW are vectors in the Power Triangle assuming the typical parallel load example as shown in Appendix 1 Figure 2, where line voltages and currents are single frequency RMS values measured at the point of instrumentation (POI).The equations shown below are the basis of the vector orientation in the Power Triangle and are based on a consumer’s typical parallel load as shown in Appendix 1 Figure 2.
In these equations, the term (I*) is defined as “I conjugate” and means that the sign of the current angle is reversed. The example in Eqn. 1 shown below illustrates how this works.
There are important assumptions that have been made in these equations to make the calculations easier but still provide adequate insight into the behavior of the Power Triangle model of energy consuming loads. These assumptions are:
- Single frequency sinusoidal functions
- Linear, passive elements, no harmonics
- RMS values
- Measurements at POI
- Rline is neglected
Utility Billing
Utility companies sell electrical energy in the units of Kilowatt-Hours, KWH. Residential customers pay (in general) what appears to be a flat rate per KWH. On the other hand, large commercial and industrial facilities are charged differently. Usually they must enter into a contract, which can (and often does) have penalties for contract violations. For example, many utilities have a sliding index on the rate at which large consumers use energy, KW. Recall the rate of energy utilization per time is watts. Utilities define this rate as “demand” with units of kilowatts, KW demand. Moreover, some utilities require large customers to maintain their Power Factor, (real power ÷ apparent power, KW ÷ KVA) within a contract range.Noteworthy Considerations
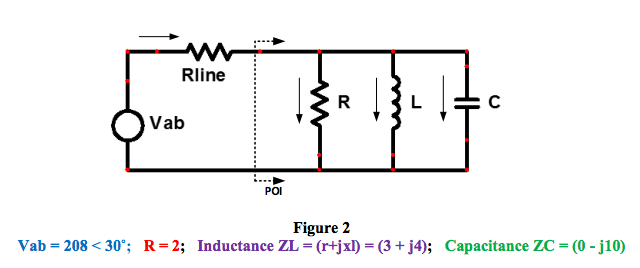
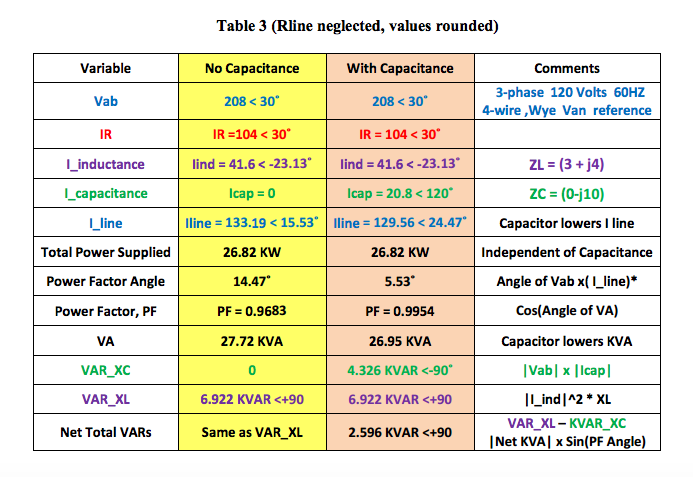
Appendix 1 Figure 2 and Table 3 illustrate an example where a user’s load is modeled as the typical parallel combination of resistance, inductance, and an optional capacitance. This is the accepted topology for a consumer’s facility. The most salient results are shown below in Table 1. Appendix 1 Table 3 has more detail.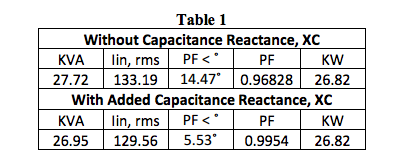
Table 1 above illustrates the important Power Triangle conclusions regarding the behavior of single frequency AC loads without harmonics when a capacitor is added.
Adding capacitance reactance:
- Has no effect on KW
- Reduces the PF angle, increases PF
- Decreases KVA and reduces line current
- Decreases line loss (I squared* Rline)
Effects of Harmonics
What happens when there are harmonics created by nonlinear loads?The following analysis assumes:
- The utility’s input voltage at the load is an ideal single frequency (60Hz) sinusoidal.
- All system elements are passive, and some are nonlinear.
While assumption 1 above is not 100% correct, it is sufficiently accurate to illustrate the effects of harmonics without complicated math.
Keep in mind that:
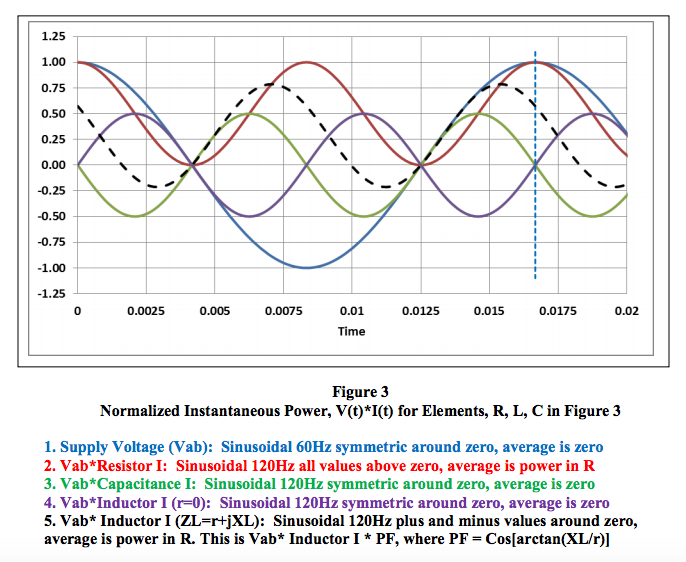
- “Power” in the 60Hz Power Triangle is the instantaneous product of voltage and current averaged over one 60Hz period. This is Vrms * Irms * PF. See Appendix 2 Figure 3 for examples of instantaneous power values.
- The average product over a 60Hz period of two sinusoids of different harmonic frequencies is ZERO.
- The Fourier Series illustrates harmonics, see Appendix 3.
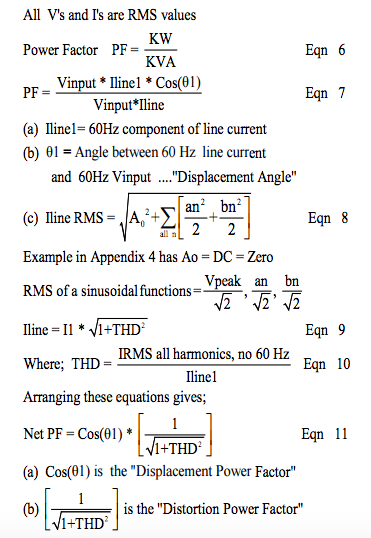
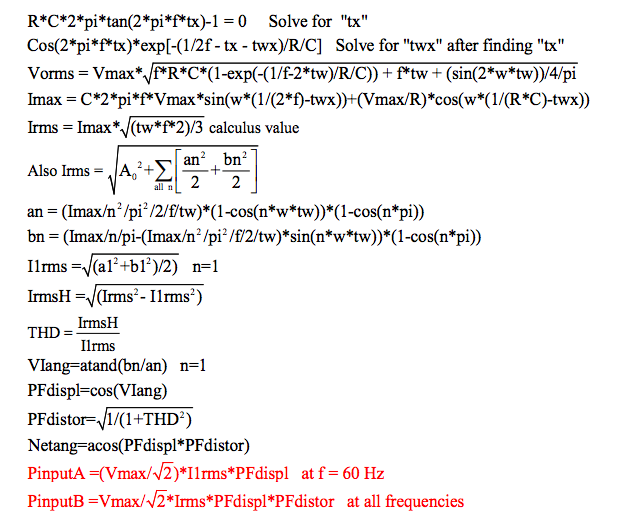
How do we account for all the power caused by harmonic current components? The example in Appendix 4 shows how, using the following equations:
RESULTS
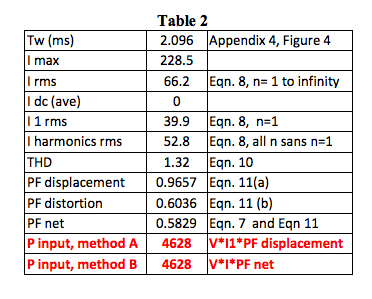
Table 2 shows results from Appendix 4, an ideal full wave rectifier math model. Of particular importance are the two input power measurement methods A and B. Note that both methods give equal results but require instrumentation capable of handling harmonics.
Conclusion
All the analysis done so far in this Application Note shows some salient points and suggests electrical energy users might want to ask a few important questions such as:- How can I reduce my utility costs?
- What are my penalty charges?
- Do I have harmonics in my system?
- Do I pay a penalty for harmonics?
- What is my power factor?
- How can I correct my PF and what is the ROI?
- For exactly what quantities am I charged?
- How does my utility company measure billing items?
- How does my utility company handle harmonics?
DATAFORTH RMS MEASUREMENT DEVICES
True RMS measurements require instrumentation devices that accurately implement the RMS equation. Dataforth has developed three RMS module families that do just that: the SCM5B33, SensorLex® 8B33, and DSCA33. All three families are made up of isolated True RMS input modules that provide 1500Vrms transformer isolation. Each module provides a single channel of AC input that is converted to its True RMS DC value, filtered, isolated, amplified, and converted to standard process voltage or current output (see Block Diagram below).The SCM5B33 and SensorLex 8B33 are plug-in-panel products; the DSCA33 is a DIN rail mount device.
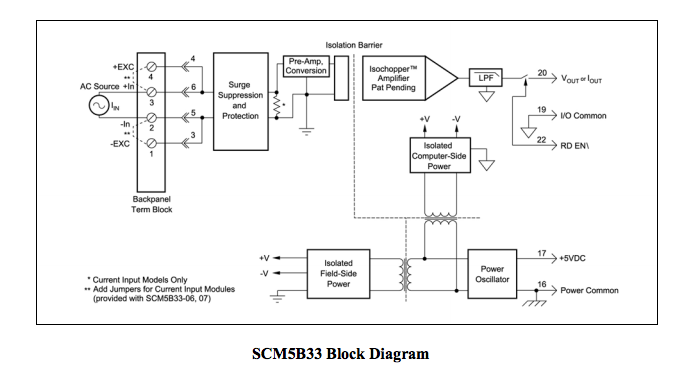
Block diagrams for the 8B33 and DSCA33 are very similar to the 5B33.
References:
- Dataforth Corp., http://liwww.dataforth.com
- Dataforth AN101 Measuring RMS Values of Voltage and Current,
http://liwww.dataforth.com/catalog/pdf/an101.pdf - Dataforth AN128 RMS Revisited, http://liwww.dataforth.com/catalog/pdf/an128.pdf.
APPENDICES
Appendix 1.The supply voltage in Figure 2 is a single phase line to line (Vab) voltage of a 3-phase 4-wire wye “abc” sequence system. The inductance “L” has an internal resistance “r”.
Appendix 2.
Normalized Instantaneous Power
Appendix 3.
The Fourier Series
Recall Fourier’s theorem, which says that a function of time “f(t)” can be expressed as a sum of sine and cosine functions over an infinite number of frequencies plus an average value term. At this point, mathematicians would hasten to give all the limitations for this theorem; however, most engineering voltages and currents are sufficiently “well” behaved that Fourier’s theorem applies. The following set of Fourier Series equations allows us to demonstrate the presence of harmonics.

Note that “fo” is the signal “f (t)” fundamental frequency and that “an” is the peak amplitude of the “nth” Cosine harmonic and “bn” is the peak coefficient of the “nth” Sine harmonic. We can use this fact to calculate the RMS of non-sinusoidal time functions by using Parceval’s Theorem for RMS, which is:

We hasten to point out that all this is interesting; however, the shape of a time function f(t) whose parameters we wish to determine is seldom, if ever, known. Therefore, from a practical point of view we rarely use this manual analysis to actually calculate values since the equation for f (t) is typically unknown. It is presented here to illustrate that non-sinusoidal functions of time are rich in harmonics (multiples of a fundamental frequency) and that the RMS value of f (t) is determined as the square root of the sum of each sinusoidal harmonic RMS value squared.
Appendix 4.
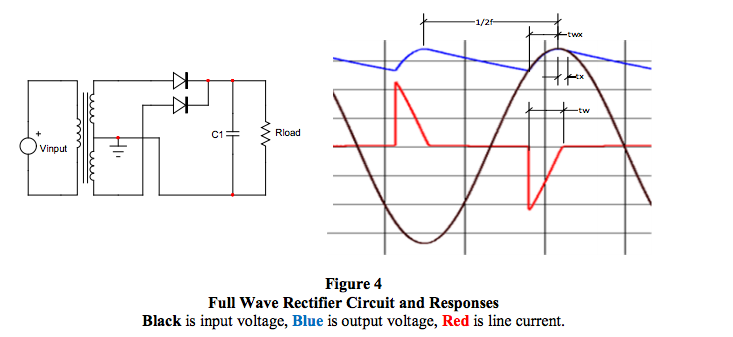
AC to DC Full Wave Rectifier with Transformer and RC Load
Definitions:
- Sawtooth pulse model is assumed to be an ideal bipolar 120Hz function, Imax*[1- (t / tw)]
- Diode begins to conduct at “twx” seconds before peak of input sinusoid
- Diode shuts off “tx” seconds after peak of input sinusoid and “C” discharges exponentially
- Sawtooth baseline width is “tw = twx+tx”
- Ideal equations are shown below
Ideal Equations for Figure 4
These equations are used in MATLAB program to calculate values in Table 2.
Was this content helpful?
Thank you for your feedback!


